
I just can’t understand what this graph means, plz someone could explain
1 Like
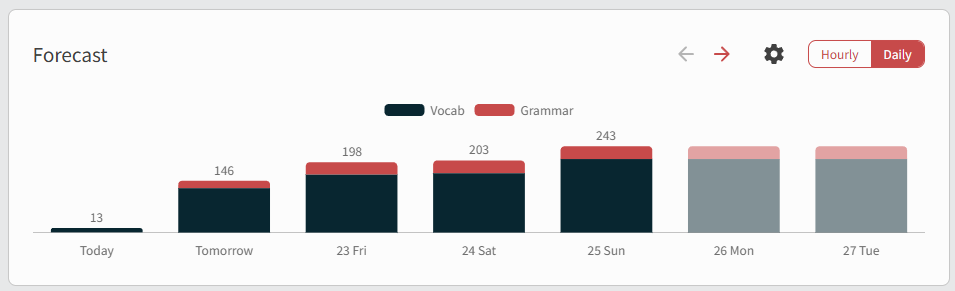
I believe it’s showing the total number of reviews that you have. So the 198 on 23rd is the 146 from tomorrow with about 50 new ones added in. You can hover over it to see how many reviews are being added each day.
3 Likes
